
As we entered the 3rd quarter of 2021, the pandemic was widely expected to be behind us. Unfortunately, there was an unexpected resurgence in the summer as the number of Covid cases rose steadily. Concerns mounted as consumers and businesses pulled back their purchases and held onto cash. As a result, the acceleration of GDP growth slowed.
As the pandemic restraints lessoned in the 3rd quarter, consumers satisfied their pent-up demand with goods and services, such as automobiles, computers, home-improvements, etc. As the economies of the world are adapting to the new paradigm, the net result is a new approach to how businesses and consumers are managing. We have listed some key bullet-points below to paint the picture of the current economic environment.
The U.S. & Global Economies:
- U.S. Leading Economic Index (LEI) increased 0.2% in September following a 0.8% increase in August and a 0.9% increase in July. The Coincident Economic Index (CEI) was unchanged in September following a 0.1% increase in August and a 0.6% increase in July. The Lagging Economic Index (LAG) increased 0.3% in September after a 0.1% increase in August and a 0.4% increase in July. Although rates continue to improve, they have slowed since the first half of the year.
- Global GDP (Gross Domestic Product) continued to show improvement as economies eased restrictions. U.S. 3rd quarter GDP grew at an annualized rate of 2.0% (less than expectations), following a 6.7% increase in the 2nd quarter. The 3rd quarter slowdown was largely due to rising cases resulting in a reduction in business activity and consumer spending. Here are some future estimates of GDP growth from around the world:
| Country / Region | 2021 GDP | 2022 GDP | 2023 GDP |
| United States | 6.0% | 5.2% | 2.2% |
| Euro Area | 5.0% | 4.3% | 2.0% |
| China | 8.0% | 5.6% | 5.3% |
| Japan | 2.4% | 3.2% | 1.4% |
| India | 9.5% | 8.5% | 6.6% |
| Advanced Economies | 5.2% | 4.5% | 2.2% |
| Emerg & Dev Asia | 7.2% | 6.3% | 5.7% |
- China’s estimated growth for 2021 is expected to be 8.0%, following a 2.3% rate in 2020. There have been concerns that a real estate debt crisis may be looming, along with increased regulatory constraints on energy consumption into the future.
- The Eurozone GDP rate was a -5.9% GDP for all of 2020. Since then, Europe has rebounded nicely with expectations of GDP for 2021 to be at a 5.0% level. Increased consumer consumption with a high level of pent-up demand for goods and services were the primary drivers of growth. In addition, Europeans have been putting cash away with approximately 480 billion euros in excess savings which provides liquidity to consumer purchases in the months and quarters ahead.
- Since the onset of the pandemic, the Fed has effectively reduced rates to zero (0.00% – 0.25%). The Fed has also made it abundantly clear they do not anticipate raising rates until the end of 2022.
- Inflation in the U.S. is currently at a 5.4% annualized rate for the month of September 2021 and is expected to trend lower between 2.0% to 4.0% over the next few years. Global inflation rates are lower, with figures expected to be below 2.0% over the next few years.
- The U.S. unemployment rate has been declining steadily since the onset of the pandemic highs (April 2020). The latest unemployment rate is now at 4.6% (as of Oct. 2021). IMF forecasts the U.S. unemployment to trend lower over the next few years to approximately 3.0%.
- In early 2020, oil prices (WTI – West Texas Intermediate) fell to around $12 a barrel. Since then, oil prices have rebounded dramatically to a current price of almost $84 per barrel.
The U.S. & Global Equity and Bond Markets
Equities
- As the economy reacted to consumers improved sentiment, U.S. large-cap stocks did very well. Large-cap stocks (as measured by the S&P 500 Index) gained 30.0% over the last twelve months (ending Sep. 30, 2021). Across the globe, the devolved markets turned in similar results with the MSCI All Countries World Index up 27.4% for the same period.
- U.S. small-cap stocks (Russell 2000) soared with a 47.7% return over the last twelve months (ending Sep. 30, 2021).
- Historical and current consensus estimates for the S&P 500 earnings & price-to-earnings ratios (P/E):
- 2019 actual earnings $162.97: P/E 19.8 (S&P 500 year-end value at 3,230.78)
- 2020 actual earnings $139.76: P/E 26.9 (S&P 500 year-end value at 3,756.07)
- 2021 future earnings estimate $205.21: P/E 21.0 (S&P 500 value 4,307.54)
- 2022 future earnings estimate $220.79: P/E 19.5 (S&P 500 value 4,307.54)
- 2023 future earnings estimate $240.63: P/E 17.9 (S&P 500 value 4,307.54)
- European stocks (MSCI Europe) were up 28.0% over the last twelve months (ending Sep. 30, 2021), as the European economy recovered from the removal of Covid-19 restrictions back in March/April.
- China (MSCI China Index) turned in negative results with a -7.2% loss (ending Sep. 30, 2021). China is dealing with issues of overabundant credit, leverage in real estate development, slowing productivity, and continuing Covid-19 outbreaks.
- Technology (MSCI World Information Technology) stocks turned in solid performance with a 29.5% gain over the last year (ending Sep. 30, 2021).
- Precious Metals (XAU – Gold & Silver Index) turned in a loss of -16.9% over the last twelve months (ending Sep. 30, 2021).
- Energy stocks (XOI – Oil & Gas Index) turned in exceptional results with an 81.4% return over the last twelve months (ending Sep. 30, 2021). These results reflect a major price increase in oil prices over the last year and a half. Oil prices on March 30th, 2020, were at $20.09, and a year later oil had risen to $75.03. Oil today is now above $84 per barrel, a more than 400% increase in price.
Bonds & Cash
- Short-term Interest rates have remained low as the Fed continues to keep rates at a near-zero level. The Fed expectations are for short-term rates to remain at or below 2.5%. Long-term rates fell after the onset of the pandemic, and since then have moved upward. (See Treasury Interest Rates chart below).
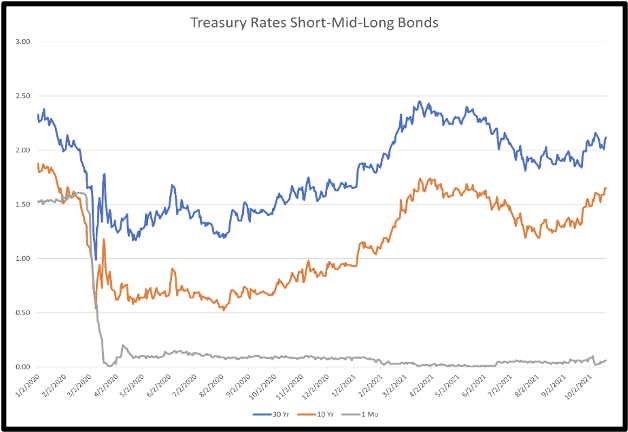
Source: U.S. Department of the Treasury
- Longer-term bonds (ICE U.S. Treasury 20+year Bond) were close to break-even with a 0.10% gain in the third quarter. Furthermore, as long-term interest rates have risen, the index decreased -10.7% over the last twelve months (ending Sep. 30, 2021).
FPC Team’s Insights & Perspective:
- Continuing from our previous commentaries, money market and bond rates are at low levels; there is little room to make substantive returns in these asset classes. As such, equities continue to have the most opportunity of the broader asset categories.
- The U.S. and global markets are awash in vast amounts of liquidity as the central banks have lowered interest rates, and governments continue to provide fiscal stimulus to their economies. Most importantly, consumers worldwide are working to satisfy their pent-up demand for goods and services which will lead to continued growth.
FPC’s Outlook
With all these different economic indicators, what is our view to the future? The global economies have bounced back dramatically since the re-openings of businesses, as well as improved employment. Growth world-wide is exceptional, and the stock markets around the globe have made excellent returns.
It is our belief that for the near-term future, the overall handling of pandemic restrictions will be the key indicator for the global economies. As people resume their pre-pandemic lives, the economies of the world should see significant improvements. The global economies appear to be in the early inflation phase (the U.S. remains to be somewhere between waypoint 3 and 4) which bodes well for the stock markets. See chart below:
The Economic Cycle
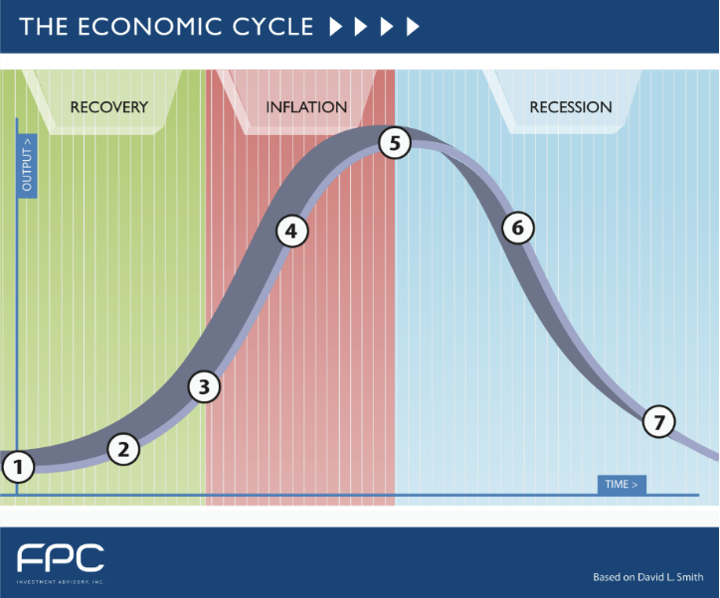
With historically low interest rates, additional fiscal stimulus, and a consumer with pent-up demand, equity markets likely have room to grow. We continue to maintain a minimum level of cash in the portfolios, since money market rates are near zero. The Fed will eventually be forced to raise rates to stave off inflation. Longer-duration bonds will decrease in value as interest rates move higher, as such short-term bonds will continue to dominate our fixed income side of the portfolios.
We greatly appreciate the confidence you have shown in our services. Thank you for your business!
Sincerely,
Blair McCarthy & Bijan Golkar, CFP®