
The third quarter brought no shortage of uncertainty for investors. Interest rates climbed to their highest levels in two decades, oil prices moved back above $100 per barrel, and the Federal Reserve raised rates for the first time in three years, all as November’s midterm elections draw closer. Markets rarely welcome this much uncertainty at once, and investors naturally wonder how these developments could affect their portfolios.
Despite these headwinds, major U.S. stock indices finished the quarter near their all-time highs, supported by strong corporate earnings. Just as important, the gains were not limited to one part of the market. Commodities, the energy sector, and international stocks have all contributed this year, and while bonds have struggled as rates rose, they now offer some of the most attractive yields in recent memory.
These trends remind us that a balanced portfolio, paired with a sound financial plan, remains the most reliable way to navigate uncertain markets. Below, we review the key drivers of the third quarter and what they may mean for investors heading into year-end.
Key Market and Economic Drivers in Q3 2026
- The S&P 500 returned 2.3% in the third quarter, and the Nasdaq Composite gained 2.6%, while the Dow Jones Industrial Average declined 2.3%. Year-to-date, the three indices have returned 12.7%, 16.1%, and 7.2%, respectively.
- Developed international stocks (MSCI EAFE) gained 0.9% over the quarter, while emerging market stocks (MSCI EM) declined -0.4%, both in U.S. dollar terms.
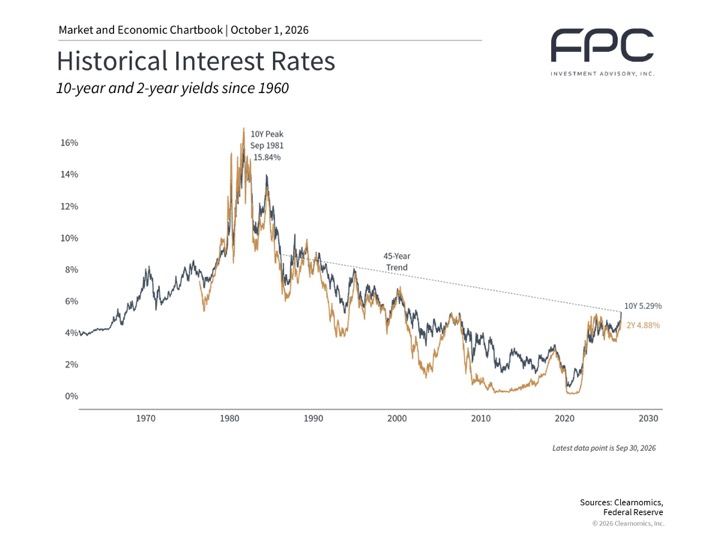
- The Bloomberg U.S. Aggregate Bond Index fell -3.5% in the third quarter and is down -2.9% year-to-date. The 10-year Treasury yield rose to 5.29%, its highest level in about two decades.
- The Bloomberg Commodity Index gained 15.1% over the quarter. Brent crude ended the quarter at $103 per barrel and WTI at $90.
- Headline CPI rose 3.4% year-over-year in August, while core CPI, which excludes food and energy, rose 2.4%. Core PCE, the Fed’s preferred measure of inflation, rose 3.0%.
- The Federal Reserve raised its policy rate to a range of 3.75% to 4.00% in September.
- Second-quarter GDP grew 2.2%, better than expected, driven largely by consumer spending.
Return figures represent total returns with dividends reinvested, as of September 30, 2026. Source: Clearnomics.
Interest Rates Have Climbed to Two-Decade Highs
The defining story of the third quarter was the steady rise in interest rates. The 10-year Treasury yield reached 5.29%, its highest level since the early 2000s, while the 2-year yield ended the quarter at 4.88%. For long-term investors, this represents a meaningful shift. From the early 1980s until 2020, interest rates trended steadily lower, a period often described as a 40-year bull market in bonds. The low-rate environment that followed the 2008 financial crisis is no longer the main backdrop for portfolio decisions.
Rising rates have weighed on bond prices this year, which is why the bond market is down year-to-date. At the same time, higher yields mean bonds can once again generate meaningful income, which is especially important for retirees and those approaching retirement who rely on their portfolios for cash flow. Higher rates also affect the broader economy. According to Freddie Mac, the average 30-year fixed mortgage rate is back above 7%, which has slowed housing activity as many homeowners are reluctant to give up the lower rates they secured in prior years.
Of course, interest rates are difficult to predict and can shift quickly with oil prices and the job market. Rather than trying to time these moves, we focus on positioning fixed income allocations to provide both stability and income.
Many Asset Classes Have Contributed to Portfolios
This year’s positive performance has not been limited to U.S. large-cap stocks. Year-to-date, commodities have gained 32.9%, emerging market stocks 23.7%, U.S. small caps 13.7%, the S&P 500 12.7%, and developed international stocks 10.8%. A hypothetical balanced 60/40 index blend has returned 8.7%, even with bonds down -2.9%.*
The drivers behind these gains differ. Strong corporate earnings, supported in part by investment in AI infrastructure, have lifted stocks both in the U.S. and abroad, including semiconductor companies in Asia. Commodities have benefited for a different reason. The ongoing conflict in the Middle East pushed oil from around $70 per barrel in early July to over $100 in September, making energy the best-performing stock sector this year with a 37.4% gain.
The fact that so many asset classes contributed clearly illustrates the value of diversification. It also means some portfolios may have drifted from their target allocations, making the fourth quarter a good time to review and rebalance.
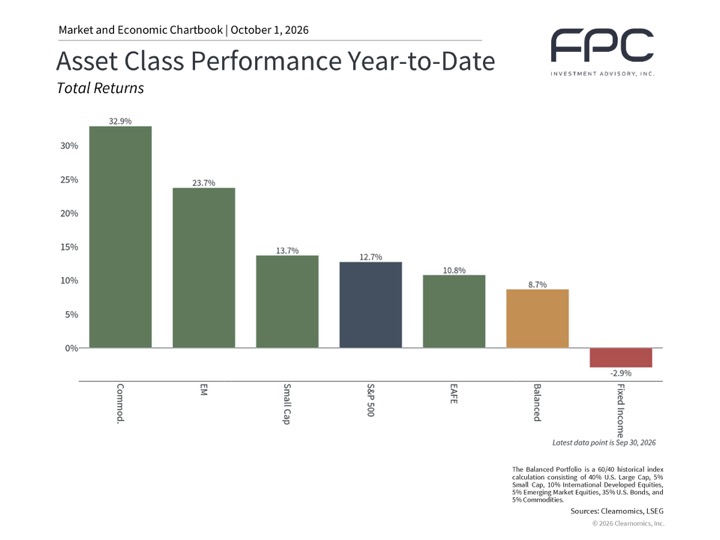
*The balanced blend is a hypothetical 60/40 index calculation by Clearnomics: 40% U.S. large cap, 5% small cap, 10% international developed, 5% emerging markets, 35% U.S. bonds, and 5% commodities. It is not an FPC model or client portfolio, does not reflect fees, and is shown for illustration only. Indexes are unmanaged and cannot be invested in directly.
The Fed Raised Rates for the First Time in Three Years
At its September meeting, the Federal Reserve raised its policy rate by one-quarter of a percent to a range of 3.75% to 4.00%. This was the first increase in three years and followed a series of rate cuts between September 2024 and December 2025. Because investors had largely anticipated the move, the market reaction was relatively muted.
What makes this hike different is why it is happening. Rather than responding to an overheating economy, the Fed is reacting mainly to higher energy prices, which economists call “cost-push” inflation. Interest rates cannot resolve supply disruptions or geopolitical conflict, but the Fed can try to prevent higher energy costs from spreading into the prices of other goods and services. Fed officials’ projections currently point to one more increase this year before a pause, although these projections can change quickly as conditions evolve.
Tighter monetary policy is naturally a headwind for markets, but history shows that much depends on the circumstances. Stocks and interest rates have often risen together later in the business cycle, when economic growth and corporate earnings are strong, and the third quarter was one such example. For savers, higher short-term rates also mean better yields on cash and money market funds.
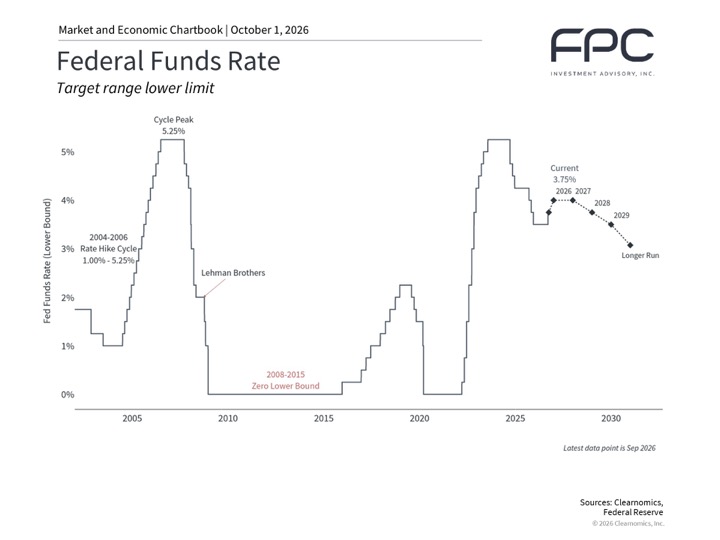
Federal Funds Rate. Points after September 2026 are Federal Reserve officials’ median projections, not FPC forecasts..
Midterm Elections and Policy Uncertainty
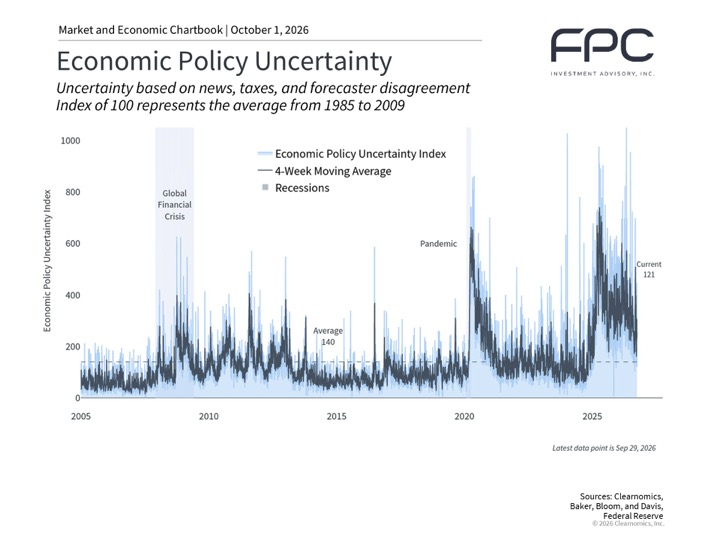
November’s midterm elections are taking place against a complex backdrop of tariffs, geopolitical conflict, inflation, and questions about AI. As the chart below shows, economic policy uncertainty has spiked repeatedly over the past two years, contributing to bouts of short-term market volatility. Markets have historically stabilized after these periods, at times more quickly than investors expected.
While elections matter a great deal to all of us as citizens, it is important not to let political views drive investment decisions. Since 1933, the S&P 500 has averaged an 8.6% total return in midterm election years, though returns have varied widely from year to year and some years have seen losses. Markets have also performed well, on average, under many different combinations of party control in Washington.
Longer-term fiscal issues also deserve attention. Total federal debt recently surpassed $40 trillion, or nearly $120,000 per American, and the budget deficit for fiscal year 2026 is projected to exceed $2 trillion. Over time, these trends could keep government borrowing costs elevated. Still, holding a portfolio designed to perform across a range of economic and political environments is more important than trying to predict the outcome of a single election.
Earnings Growth Is Broadening Beyond AI
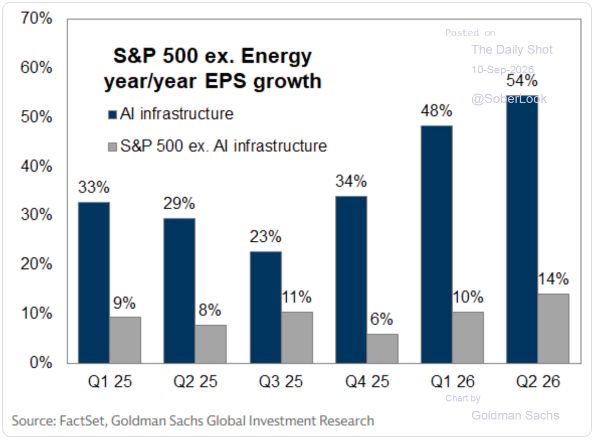
AI and technology have been major drivers of market returns over the past decade, and some investors are concerned that too much of the market’s performance now depends on a small group of companies. The chart below offers some helpful perspective. In the second quarter, earnings for AI infrastructure companies grew 54% from a year earlier, while earnings for the rest of the S&P 500, excluding energy, grew a healthy 14%.
This broadening of earnings growth is an encouraging sign, since it means more sectors are contributing to the market’s underlying fundamentals. Much of today’s AI investment focuses on building data centers and other infrastructure, and the bigger question is whether AI will ultimately boost productivity across the economy, as the internet did. Productivity growth has averaged 2.1% per year so far this decade, compared with 1.2% in the 2010s. Whether AI can sustain or improve on that pace remains an open question.
It is also worth noting that U.S. stocks currently trade at a significant valuation premium to international markets, which is one reason we continue to emphasize global diversification.
What We Are Watching in Q4
Several of the same themes are likely to remain in focus through year-end. Oil prices and the conflict in the Middle East will continue to influence inflation and, in turn, the Fed’s next steps. Long-term interest rates will matter for both bond investors and the housing market, and the midterm elections may bring additional headline-driven volatility.
At the same time, corporate earnings remain strong and are broadening beyond technology, which has historically driven long-term returns more than any single policy decision or election. Rather than predicting how each of these events will unfold, we remain focused on keeping portfolios balanced and aligned with each client’s goals.
The bottom line? Stocks finished the third quarter near record highs, and many asset classes contributed to portfolios, even as rising interest rates weighed on bonds. With the Fed, oil prices, and the midterm elections in focus, staying balanced and focused on long-term financial goals remains the best approach.