
As we ended 2021, the world economies started to look past the pandemic. Today, the world is confronted with massive inflation, supply chain chaos, and slowing (but still positive) global growth. This coupled with the mixed policies of the world’s central banks makes for a challenging investment environment. Below you will find some key points on our current economic landscape.
The U.S. & Global Economies:
- U.S. Leading Economic Index (LEI) increased 0.8% in December following a 0.7% increase in November and a 0.7% increase in October. The Coincident Economic Index (CEI) was up 0.2% in December following a 0.1% increase in November and a 0.5% increase in October. The Lagging Economic Index (LAG) increased 0.2% in December after a 0.1% increase in November and a 0.3% increase in October. It is important to note that the leading indicators started to increase towards the end of the year which indicates continued expansion in the US economy.
- While we have all been hearing that growth is slowing, it is important to remember this does not mean it is forecasted to turn negative. While GDP (Gross Domestic Product) is coming down from elevated levels, it continues to expand. The International Monetary Fund (IMF) recently downgraded their 2022 forecast of global growth to 4.4%. Here are some future estimates of GDP growth from around the world:
| Country / Region | 2021 GDP (estimate) | 2022 GDP (estimate) | 2023 GDP (estimate) |
| United States | 6.0% | 5.2% | 2.2% |
| Euro Area | 5.1% | 4.2% | 2.2% |
| China | 8.0% | 5.6% | 5.3% |
| Japan | 2.4% | 3.2% | 1.4% |
| India | 9.5% | 8.5% | 6.6% |
| Advanced Economies | 5.2% | 4.5% | 2.2% |
| Emerging & Dev. Asia | 7.2% | 6.3% | 5.7% |
Source: IMF
- In the fourth quarter, the U.S. economy turned in a robust 6.9% annualized GDP growth rate, rising above the 2.3% rate in the third quarter. For the full year, the economy grew 5.7%, the largest annual increase since 1984.
- China’s estimated growth for 2021 is expected to be at 8.0% with expectations slowing to 5.6% in 2022. Longer-term, China faces concerns with real estate debt, a shrinking labor force, and difficulties in raising capital to fund future growth. Growth in the decade ahead for China looks to be around half the growth rate of previous decades.
- European GDP has transitioned from being in recovery mode to a more normal expansion. Consumer consumption continued with a high level of pent-up demand for goods and services. GDP growth is forecast to be 4.2% for 2022, and 2.2% in 2023.
- Japan, the fourth largest economy in the world, continues in a slow, almost stagnation-level of GDP growth, forecasted to be 1.4% in 2023. Near-term, the Japanese economy shrank in the third quarter of 2021 by -0.9%. This was caused largely by a resurgence in COVID-19 cases, a reduction in household consumption, and persistent supply chain disruptions.
- Since the onset of the pandemic, the Fed has effectively reduced interest rates to zero (0.00% – 0.25%). The Fed had taken the position that there was little need for increases in the Fed Funds rate until the end of 2022. More recently, the Fed has changed their policy to consider a more aggressive stance. The central bank is now expected to, at minimum, raise rates three times in 2022, which would put the Fed Funds rate at 0.75% by year-end.
- Inflation increased in the U.S. over the last year and is at a 7.0% rate for the twelve-month period ending December 2021, the largest 12-month increase since 1982. (See CPI Inflation Chart below) Much of the inflation is a result of supply chain issues and an inability to get goods out to consumers. Additionally, energy costs have risen dramatically over the last year with the energy component of CPI (Consumer Price Index) rising 29.3%.
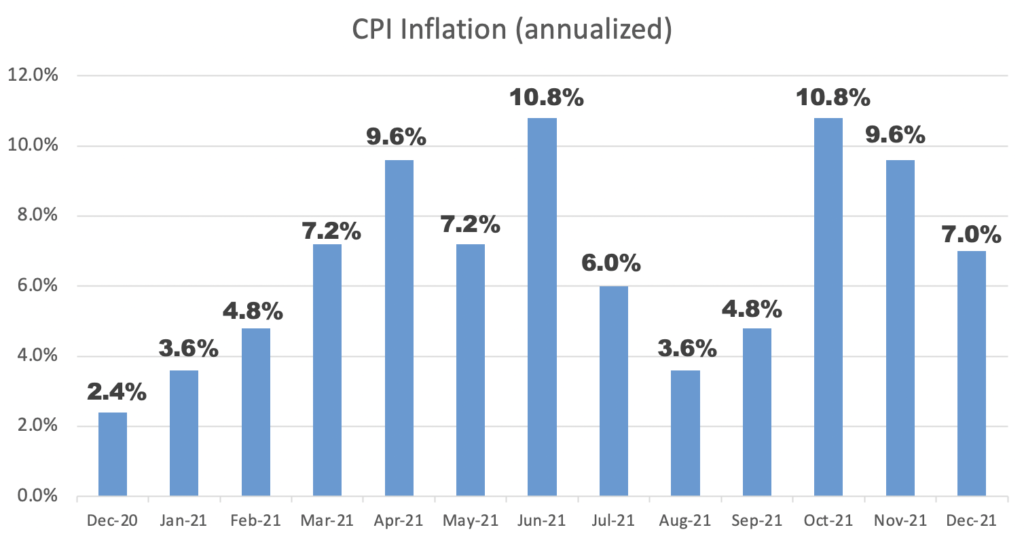
Source: Bureau of Labor Statistics
- Oil prices continue to climb from the pandemic lows, when prices (WTI – West Texas Intermediate) fell to around $12 a barrel. Since then, prices have rebounded dramatically, and are currently above $87 a barrel.
- The number of Americans applying for unemployment has fallen below 200,000, further evidence that the job market continues to be strong. The latest unemployment rate is now at 3.9% (as of Dec. 2021). The IMF forecasts the U.S. unemployment rate to trend lower over the next few years to approximately 3.0%.
The U.S. & Global Equity and Bond Markets
Equities
- As the economy reacted to consumers improved sentiment, U.S. large-cap stocks did well. Large-cap stocks (as measured by the S&P 500 Index) gained 28.7% over the last twelve months (ending Dec. 31, 2021). Across the globe, the developed markets turned in positive results with the MSCI All Countries World Index (ACWI) up 18.5% for the same period.
- U.S. small-cap stocks (Russell 2000) did well with a 14.8% return over the last twelve months (ending Dec. 31, 2021).
- Historical and current consensus estimates for the S&P 500 earnings & price-to-earnings ratios (P/E):
- 2019 actual earnings $162.97: P/E 19.8 (S&P 500 year-end value at 3,230.78)
- 2020 actual earnings $139.76: P/E 26.9 (S&P 500 year-end value at 3,756.07)
- 2021 future earnings estimate $205.79: P/E 21.0 (S&P 500 year-end value 4,766.18)
- 2022 future earnings estimate $223.35: P/E 19.7 (S&P 500 current value 4,397.94)
- 2023 future earnings estimate $245.71: P/E 17.9 (S&P 500 current value 4,397.94)
- European stocks (MSCI Europe) were up 16.3% over the last twelve months (ending Dec. 31, 2021), as the European economy continued to improve.
- Japanese stocks were up slightly in 2021 with a 2.0% return as their economy was being challenged by supply-chain issues.
- China (MSCI China Index) turned in negative results with a -21.6% loss for the year (ending Dec. 31, 2021). The MSCI China Index is trading at a much lower PE ratio of 12.1. China is dealing with over-leverage in real estate development, slowing productivity, and Covid-19 outbreaks.
- Technology (MSCI World Information Technology) stocks turned in solid performance with a 29.9% gain over the last year (ending Dec. 31, 2021). It is worth noting that the technology sector has had a rapid correction since the beginning of 2022.
- Precious Metals (MSCI ACWI IMI Precious Metals and Minerals Index) ended at mostly break-even with a slight increase of 0.3% over the last twelve months (ending Dec. 31, 2021).
- Energy stocks (MSCI USA Energy Index) turned in exceptional results with an 51.0% return over the last twelve months (ending Dec. 31, 2021). The results reflect a major price increase in oil since the lows of March 2020.
Bonds & Cash
- Short-term Interest rates remained low as the Fed continued to keep rates at a near-zero level. See Treasury Interest Rates chart below:
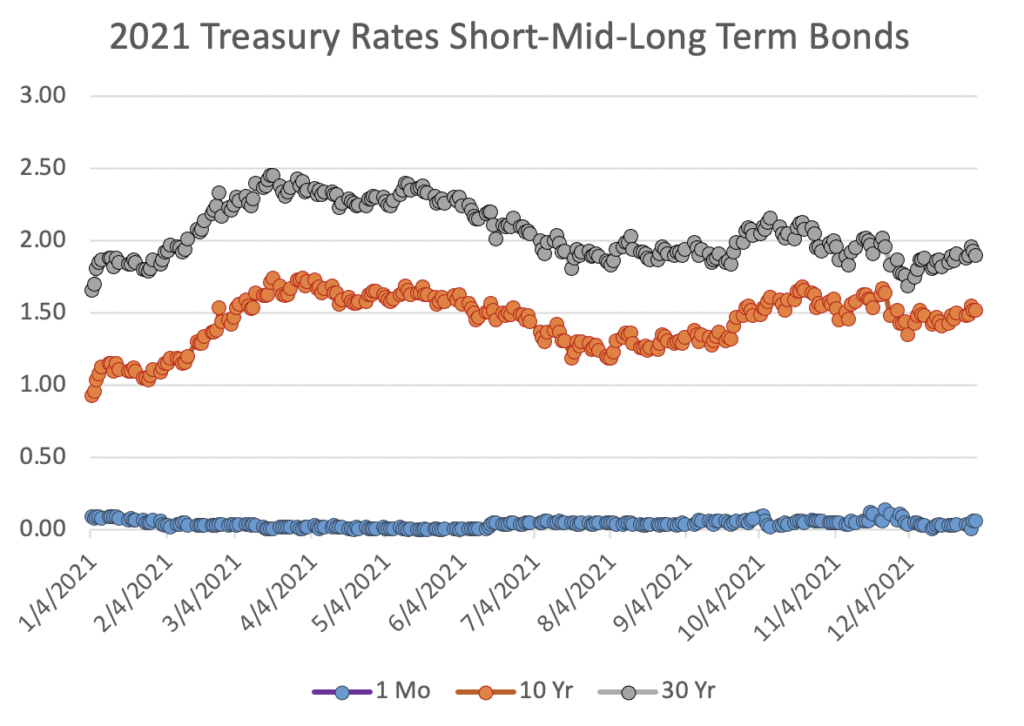
Source: U.S. Department of the Treasury
- Longer-term bonds (ICE U.S. Treasury 20+year Bond) were down significantly with a decline of -4.34% over the last twelve months (ending Dec. 31, 2021). The market decline of the long bonds is a reflection rising interest rates.
FPC Team’s Insights & Perspective:
- Continuing from our previous commentaries, money market and bond rates are at low levels; there is little room to make substantive returns in these asset classes. As such, equities continue to have the most opportunity of the broader asset categories.
- The U.S. and global markets are awash in vast amounts of liquidity as the central banks have lowered interest rates, and governments continue to provide fiscal stimulus to their economies. Most importantly, consumers worldwide are working to satisfy their pent-up demand for goods and services which should lead to further growth.
FPC’s Outlook
Our current view is that most of the global economies are in the mid-stages of the economic cycle. Domestic economic issues include the COVID-19 pandemic, supply-chain issues, inflation levels not seen in decades, along with massive inputs of both monetary and fiscal stimulus. Consumers and businesses are challenged on how best to cope in this complex environment. Growth world-wide is exceptional, and the global stock markets have made excellent returns. Most importantly, there is little to indicate that there might be a recession which might result in a bear market here and abroad. Notwithstanding, there is a high probability of a market correction in our near future as there needs to be some market adjustment to more a reasonable valuation. The current market pullback (January 2022) has lowered valuations, but they are still historically above average at the time of this writing.
It is our belief that for the near-term future, all eyes will be on global monetary policy and the overall handling of pandemic restrictions. As people resume their pre-pandemic lives, the economies of the world should see significant improvements. Most economies of the world appear to be in an early inflation phase, which should bode well for the stock markets. The U.S. remains somewhere between waypoint 3 and 4; while there is still ongoing growth, inflation is beginning to rise. See the Economic Cycle chart below:
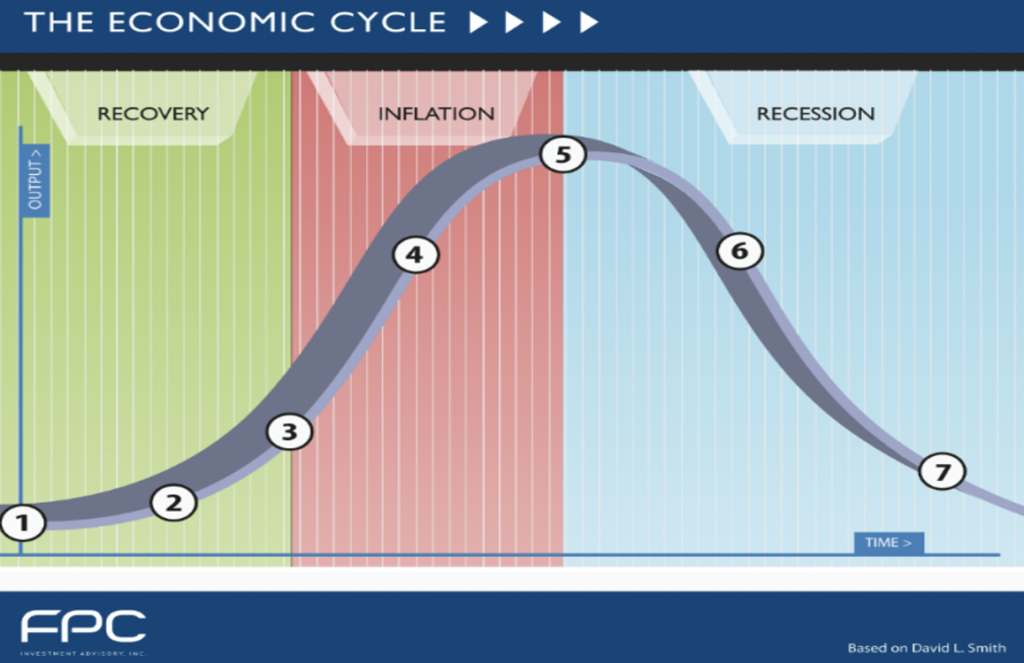
The Economic Cycle
With historically low interest rates, fiscal stimulus, consumers with pent-up demand, the equity markets likely have room to grow. We continue to maintain a minimum level of cash in the portfolios, since money market rates remain near zero. The Fed has indicated that they will need to raise rates to stave off inflation while keeping GDP growth and employment stable. Lastly, longer-duration bonds will decrease in value as interest rates move higher, and as a result, short-term bonds will continue to dominate our fixed income side of the portfolios.
We greatly appreciate the confidence you have shown in our services. Thank you for your business!
Sincerely,
Blair McCarthy & Bijan Golkar, CFP®